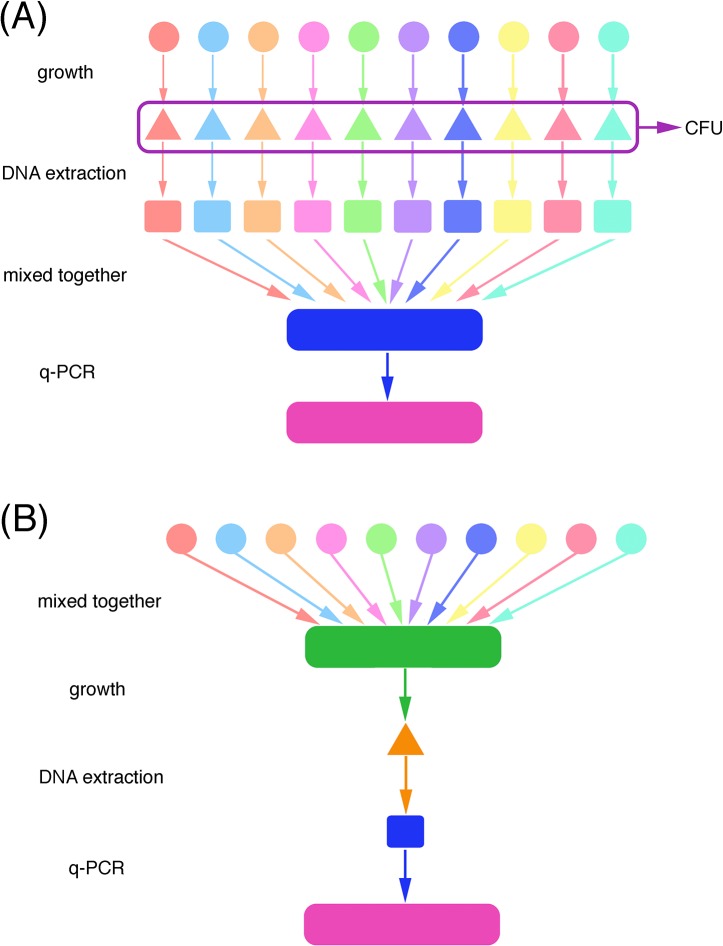
Fig 1. Schematic diagram of sample preparation.
Panels A and B demonstrate the DNA processes of the reference mixed culture and the unknown mixed culture, respectively. Ten different colors in the first row represent 10 different species. Solid circles represent overnight bacterial cultures of each species, triangles represent the cultures that have grown for a stated period of time, and squares represent the DNA extracts from the samples.

