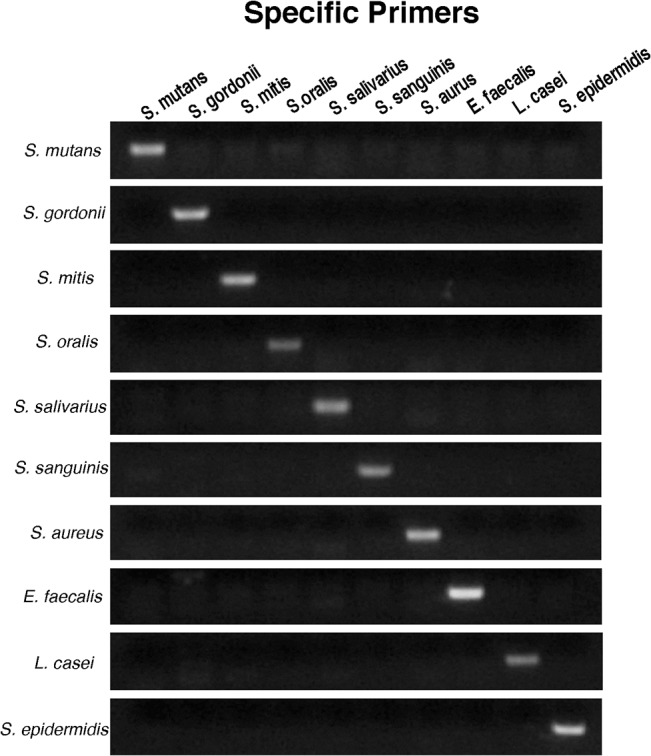
Fig 2. Primer validation.

DNA of each species was loaded with the species-specific primers from each of the ten species for PCR. Each horizontal row represents the DNA extracted from one strain, and each vertical column represents the strain specific-primers of each strain.
