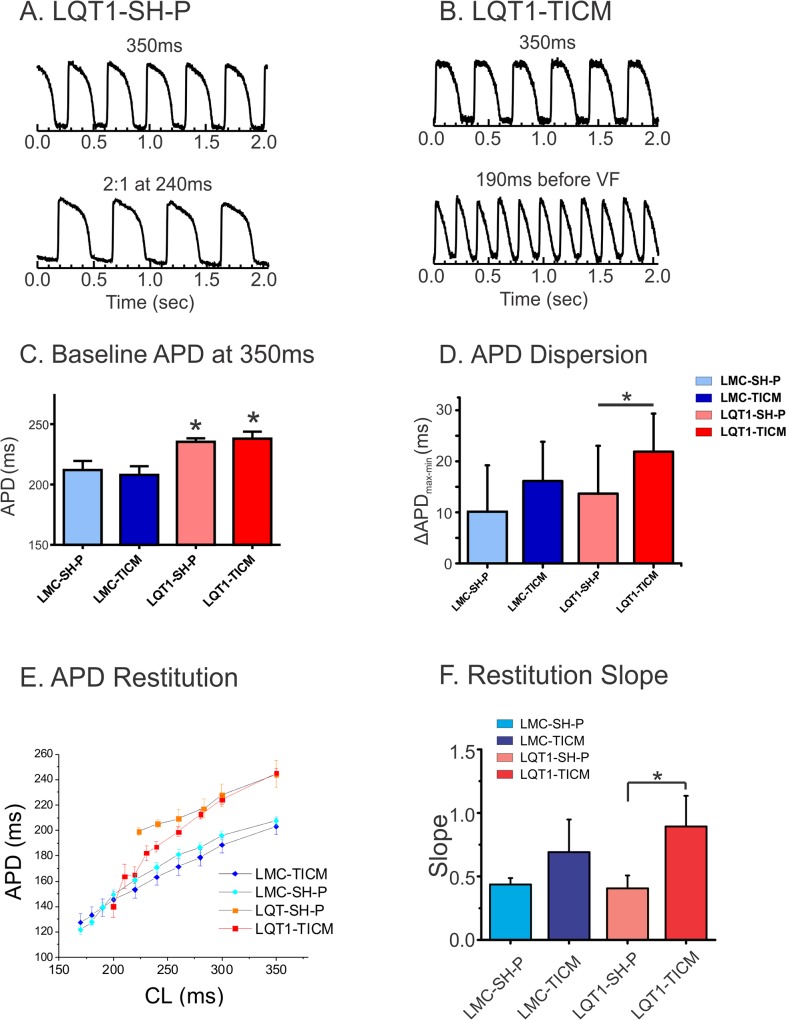
Fig 3. APD dispersion and restitution in TICM rabbits.
(A&B): Typical raw data of action potential traces from optical mapping. LQT1-SH-P shows 2:1 block at 240 ms CL, while LQT1-TICM was paced as low as 190 ms CL with marked shortening of APD. (C) Mean APD in each group at basic cycle length of 350 ms. LQT1 rabbits show statistically significant differences in APD compared with LMC; *P<0.05. (D) APD dispersion increased in LQT1-TICM. (E) APD restitution curves from four groups. (F): Maximum slopes of the APD restitution curves. LQT1-TICM demonstrates increase in APD restitution slopes (*P<0.05).

