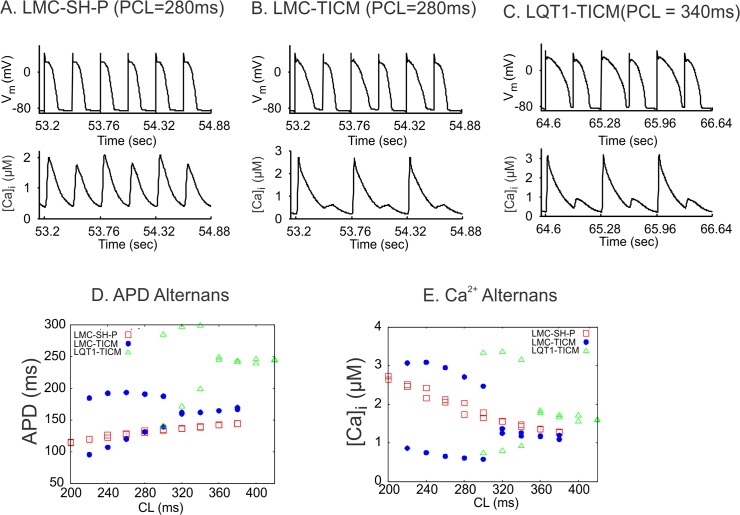
Fig 6. Computer simulations of APD and Ca2+ alternans under different conditions.
(A) Vm (upper) and whole-cell Ca2+ concentration (lower) versus time for the control condition at CL = 280 ms. (B) Vm and whole-cell Ca2+ concentration versus time for the HF condition. (C) Vm and whole-cell Ca2+ concentration versus time for the same condition as in B but with zero IKs. (D) Peak whole-cell Ca2+ concentrations of two consecutive beats versus CL for the three conditions. (E) APD of the same two consecutive beats as in D versus CL for the three conditions.

