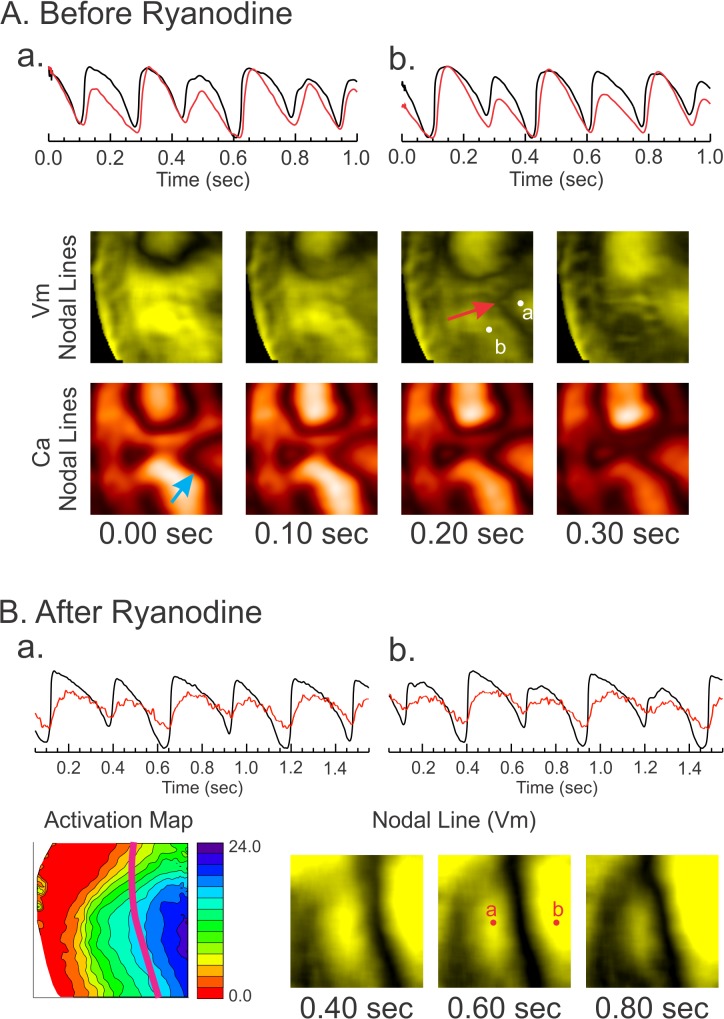
Fig 7. The effect of ryanodine on DA.
(A) Complex Ca2+ DA in LQT1-TICM. Top: Vm and Ca2+ traces from three locations. Note that the phase shift from short-long to long-short occurs in Ca2+, which was followed by Vm. Bottom: Series of nodal line images. Initially, a single nodal line was observed in Vm, while an additional nodal line was seen in Ca2+ (blue arrow). Several beats later, a nodal line appeared in Vm, which is in close proximity to the Ca2+ nodal line (red arrow). (B) Nodal line behavior after 2 μM ryanodine. DA were observed in only one third of LQT1-TICM hearts with ryanodine (3 of 9 hearts). The series of nodal line images shows that the beat-to-beat changes in DA were minimal and closely related to the activation pattern.

