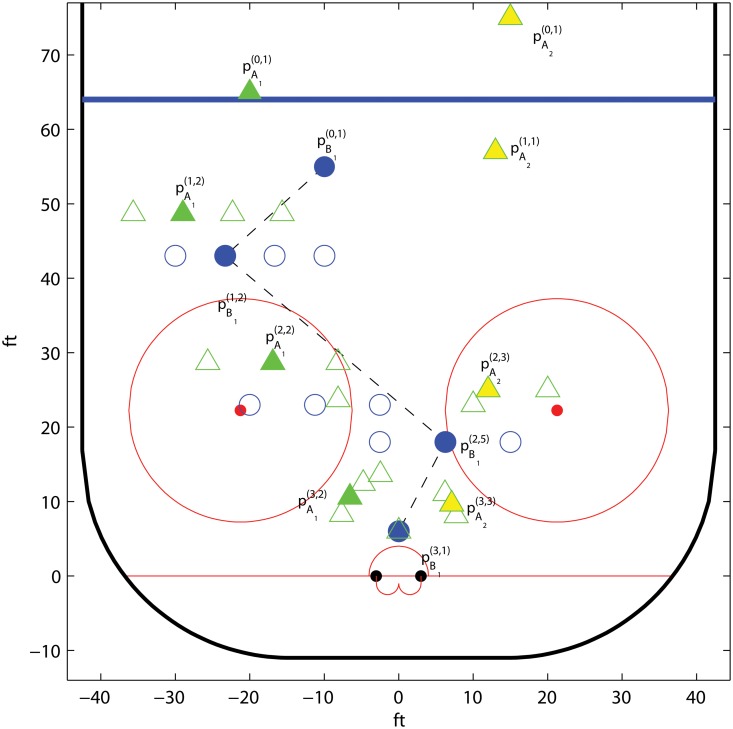
Fig 10. Example of a grid and the corresponding optimal trajectories for A 1, A 2, and B 1, in the example Ice hockey; two against one.
The offensive players are denoted by triangles, where a solid triangle marks the possession holder, and the defender is denoted by a circle. We use the shot potential model in Section Ice hockey; parametric isolines with parameters α = β = 0.2, λ = 0.03, q p = 0.1, and q c = 0.5.

