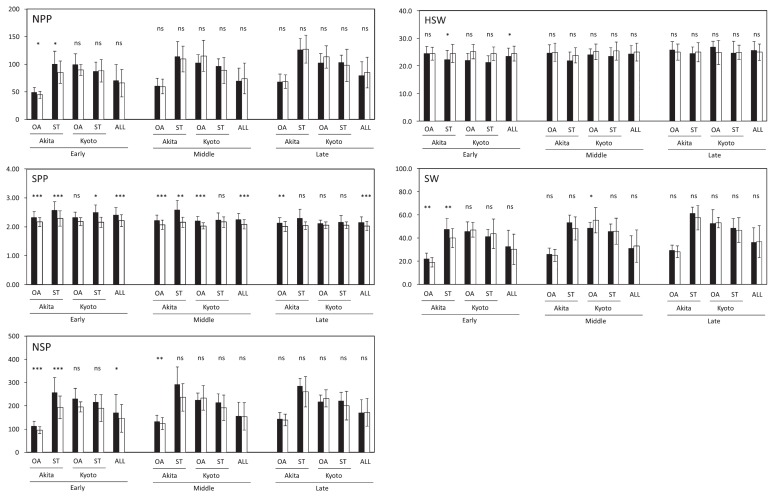
Fig. 3.
Comparison of SW and its yield components between indeterminate (IND) and determinate (DET) lines with early, middle and late MT in OA-RILs and ST-RILs. *, **, ***: significant at 5.0%, 1.0% and 0.1% levels, respectively (Student’s t-test). RILs were classified into three groups, i.e., early, middle and late MT, in each location by dividing the difference of days between the earliest and latest MT lines into three equal parts. Black and white bars indicate IND and DET, respectively. NPP: number of pods per plant, SPP: number of seeds per pod, NSP: number of seeds per plant, HSW: 100-seed weight, SW: seed weight per plant. The data of OA-RILs in Akita include the data of OA-RILs in Akita in 2009 and 2010.

