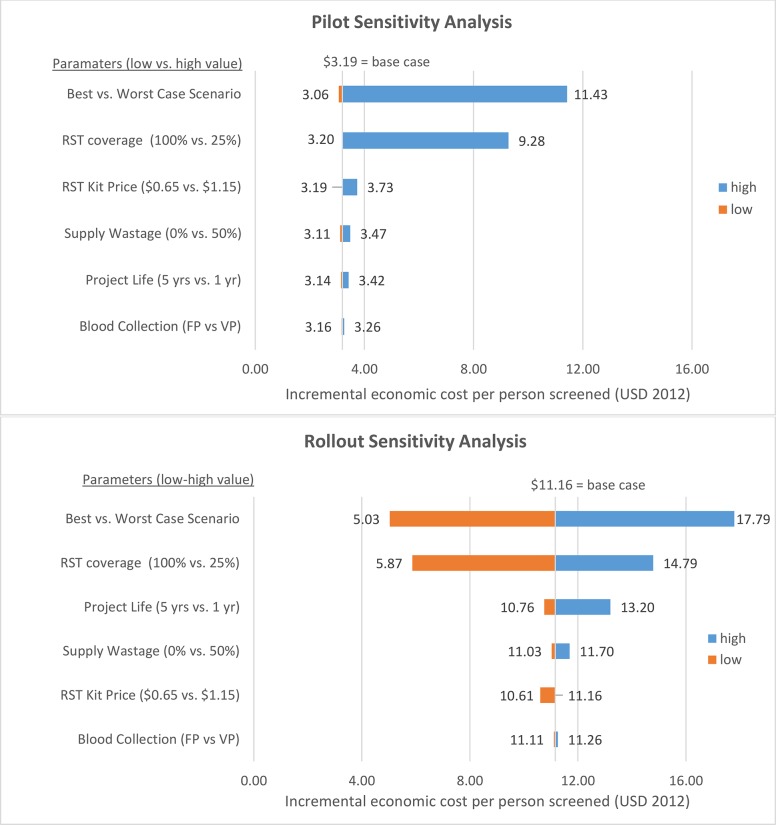
Fig 2. Tornado diagram of one-way and multivariate sensitivity analyses of incremental cost per person screened at pilot and rollout facilities (2012 USD).
A range of uncertain parameters was varied in one-way sensitivity analyses; parameters are displayed along the vertical axis. The solid vertical line indicates the base case incremental cost per person screened for syphilis ($3.19 during pilot; $11.16 during rollout). The horizontal bars represent the range of cost per person screened when varying the associated parameter from the low to high values indicated in parentheses. The best versus worst case scenario is a multivariate representation when all parameters are set to the low versus high values. During pilot and rollout, the cost per person screened was most highly sensitive to RST coverage among ANC attendees. FP = Finger prick; VP = Venepuncture.

