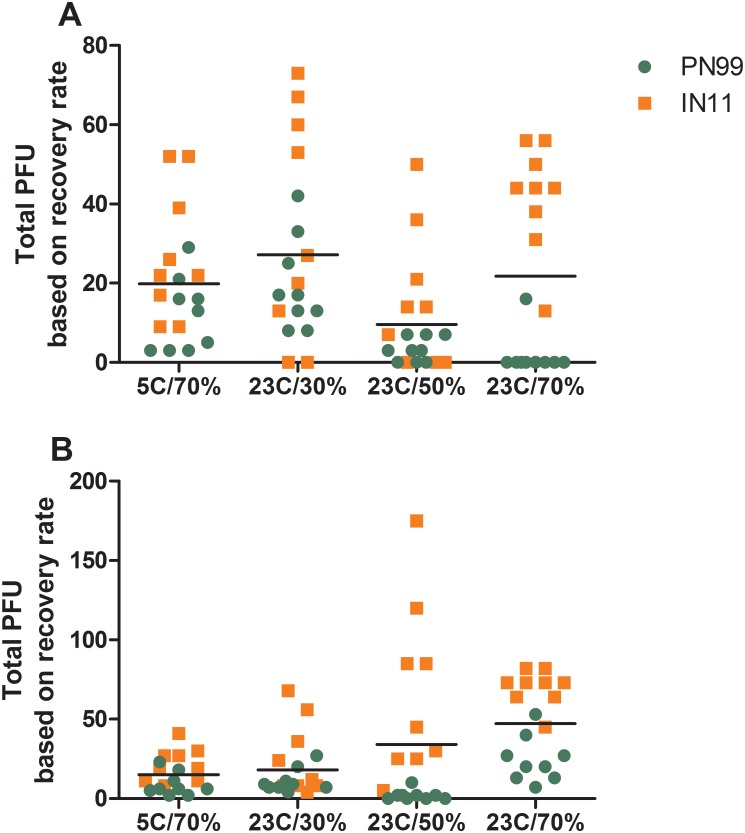
Fig 8. Influenza virus in aerosol samples exhaled by infected ferrets based on recovery rates.
Three ferrets each were housed under the designated environmental conditions and were presented with 103.8–105.5 pfu of PN99 (green) or IN11 (orange) virus by aerosol inhalation. Aerosol samples were collected from ferrets on 1, 3, and 5 dpi for 15 minutes of normal breathing (A) and 5 minutes of sneezing stimulation (B). Total plaque forming units (pfu) collected from infected ferrets were normalized based on the recovery rates of known amounts of infectious virus using our aerosol collection procedure. Total pfu exhaled by infected ferrets in both size ranges combined and at each time point are presented. Each dot represents a single animal at a single time point. Scatter dot plots show the distribution of data with the horizontal line representing the grand mean for all samples collected under the designated condition.

