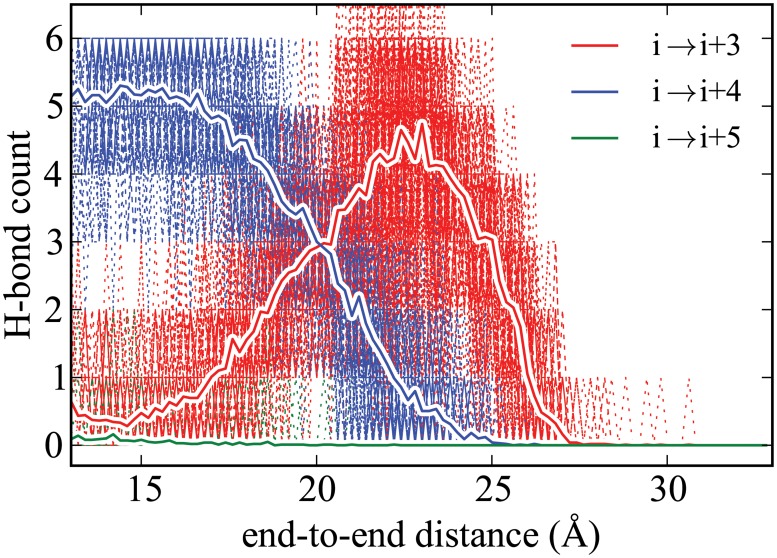
Fig 5. Hydrogen-bonding profile for ALA10 in vacuum calculated using ASMD at simulation conditions, 1 Å/ns with 100 tps, differing with those of our earlier work.
[34] The red, blue and green solid lines corresponds to the average number of i → i + 3 (310-helix), i → i + 4 (α-helix), and i → i + 5 (α-helix) contacts, respectively. They are overlaid onto scatter plots showing the range of values visited by the specific trajectories, thereby indicating the error in the averages.

