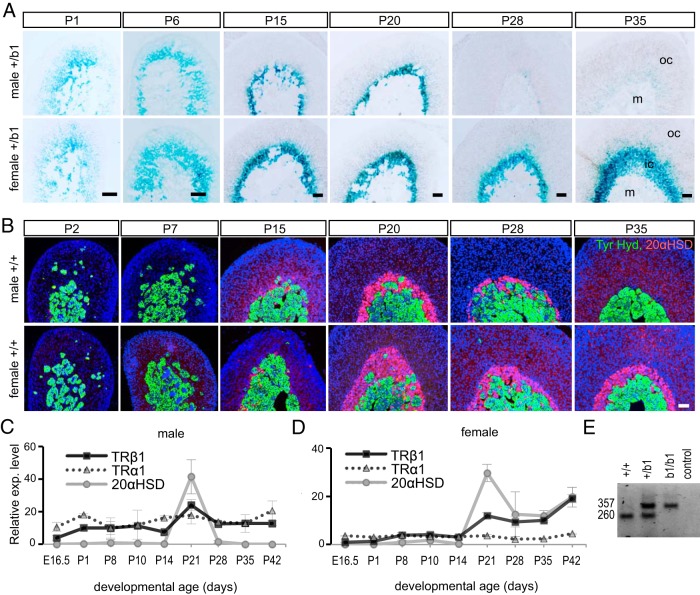
Figure 1.
Expression of TRβ1 in the adrenal inner cortex, A, X-gal staining (blue) showing expression in the adrenal inner cortex of lacZ in heterozygous Thrb+/b1 (+/b1) male and female mice. X-gal staining revealed sexually dimorphic regression after P20. B, Immunofluorescence showing the expression profile of 20αHSD (red, in inner cortical X-zone), tyrosine hydroxylase (Tyr. Hyd., green, in medulla), and DAPI (blue, all cell nuclei) in the adrenal. DAPI, 4′,6′-diamino-2-phenylindole; ic, inner cortex, m, medulla, oc, outer cortex. C and D, Relative levels of mRNA for TRβ1, TRα1, and 20αHSD in adrenal development detected by qPCR. The profiles of TRβ1 and 20αHSD were similar with a peak near weaning age, whereas TRα1 was expressed more constantly throughout development (means ± SD, n = 3 mice per age). E, embryonic day. E, RT-PCR showing predicted bands for wild-type TRβ1 (260 bases) and fusion TRβ1-lacZ (357 bases) mRNA in adrenal samples from +/+, +/b1, and b1/b1 mice. Scale bars, 50 μm.

