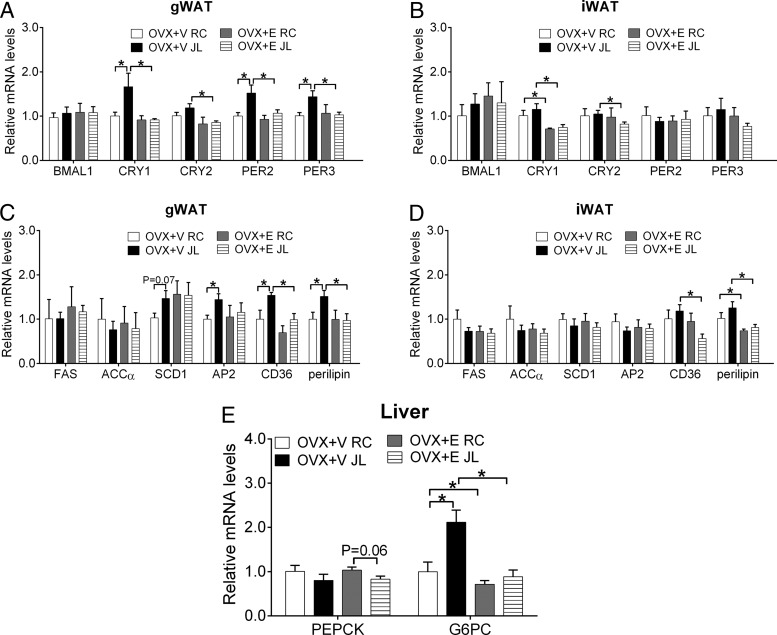
Figure 4.
Relative mRNAs of indicated genes in gWAT (A and C), iWAT (B and D) and liver (E) from female OVX+V or OXV+E mice subjected to JL or RC. Note that tissues were isolated at ZT13–ZT16 during the normal phase of the 9th cycle; n = 6–7 per group. Data are presented as mean ± SEM. *, P < .05 in two-way ANOVA analyses followed by post hoc Bonferroni tests.

