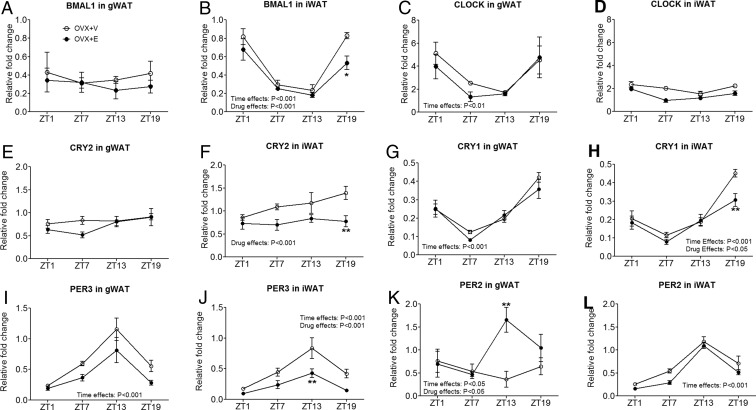
Figure 5.
Levels of mRNAs of indicated genes at ZT1, ZT7, ZT13, and ZT19, in gWAT or iWAT of OVX+V or OVX+E female mice; n = 4–5 per group. Data are presented as mean ± SEM. Overall effects of drug (OVX+V vs OVX+E) or those of time (ZT1, ZT7, ZT13, and ZT19) in two-way ANOVA analyses are indicated as text. *, P < .05; **, P < .01 in two-way ANOVA analyses followed by post hoc Bonferroni tests.

