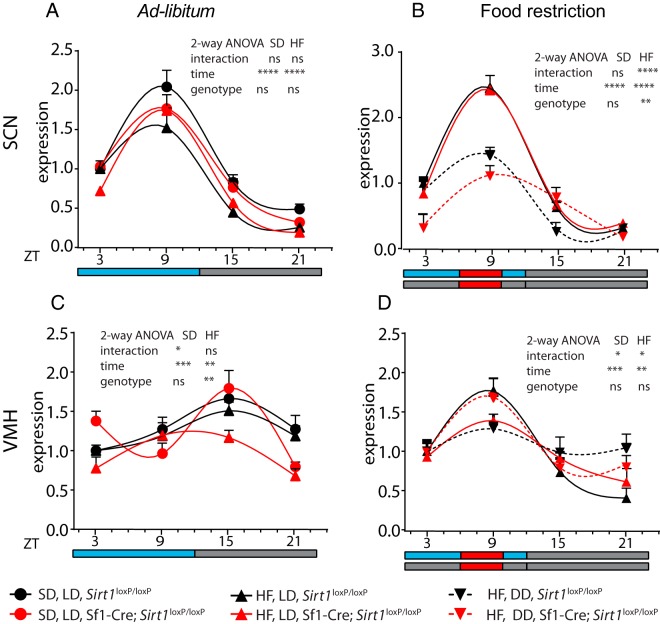
Figure 4.
Daily expression profile of Per2 is altered in the SCN and VMH of Sf1-cre;Sirt1loxP/loxP mice under FR. The nuclei were microdissected from the brain of the mice (see Supplemental Figure 1, A and D) killed every 6 hours and fed ad libitum (A and C) or FR (B and D). Black symbols, Sirt1loxP/loxP mice; red symbols, Sf1-cre;Sirt1loxP/loxP; circles and solid lines, SD and LD; triangles and solid lines, HF diet and LD; inverted triangles and dotted lines, HF diet, DD conditions. Significance between genotypes at specific ZT and experimental condition is indicated by the symbols: ψ, SD, LD; HF diet, LD. *, HF diet, DD; (one symbol, P < .05; two symbols, P < .01; three symbols, P < .001; two-way ANOVA followed by Bonferroni's test; n = 6 mice per group).

