Figure 2.
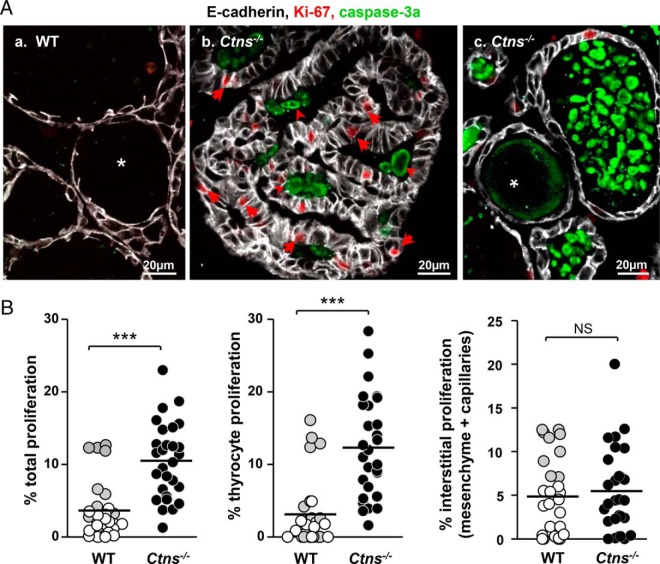
Cystinosis induces follicle-autonomous thyrocyte proliferation and apoptosis. A, Confocal microscopy. Immunofluorescence for E-cadherin (white; thyrocyte basolateral membrane), Ki-67 (red; cell proliferation marker), and activated caspase-3 (green, apoptosis marker) in 9-month WT (a) and Ctns−/− (b, c) thyroids. Notice numerous proliferating cells (arrows) in Ctns−/− hyperplastic follicles, pointing to autonomous follicular response, whereas Ki-67 labeling in WT thyrocytes is very rare. At panel c, large collections of apoptotic bodies in the follicular lumen of Ctns−/− thyroid (arrowheads) indicate accelerated cell turnover. All scale bars, 20 μm. B, Quantification of proliferation. Percentage of total nuclei area stained for Ki-67 in whole tissue (total proliferation) or associated with E-cadherin (thyrocyte proliferation) as estimated by morphometric analysis in 9-month WT (open and gray symbols; gray identifies a special WT individual) and Ctns−/− thyroids (filled symbols) (n = 3). For each mice, 3.4 105 μm2 of area corresponding to nine fields spanning the entire thyroid section were analyzed. Proliferation is specifically increased in Ctns−/− thyrocytes. ***, P < .001.

