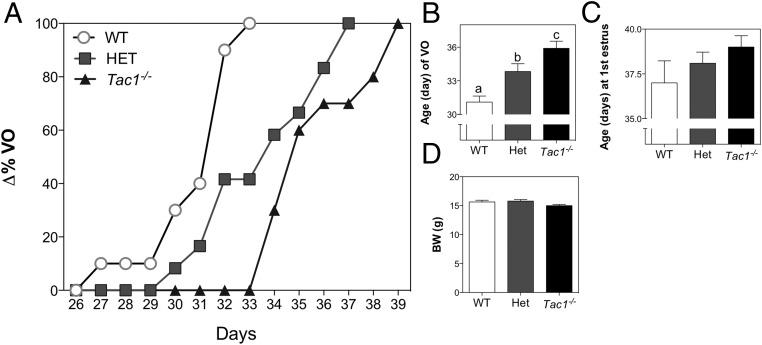
Figure 4.
Pubertal progression of Tac1−/− female mice. A, Percentage of mice showing VO at each age. B, Mean age of VO. C, Age of first estrus. D, BW at p32. One-way ANOVA followed by Newman-Keuls post hoc test was performed to compare all groups. Different letters indicate significantly different values (P < .05).

