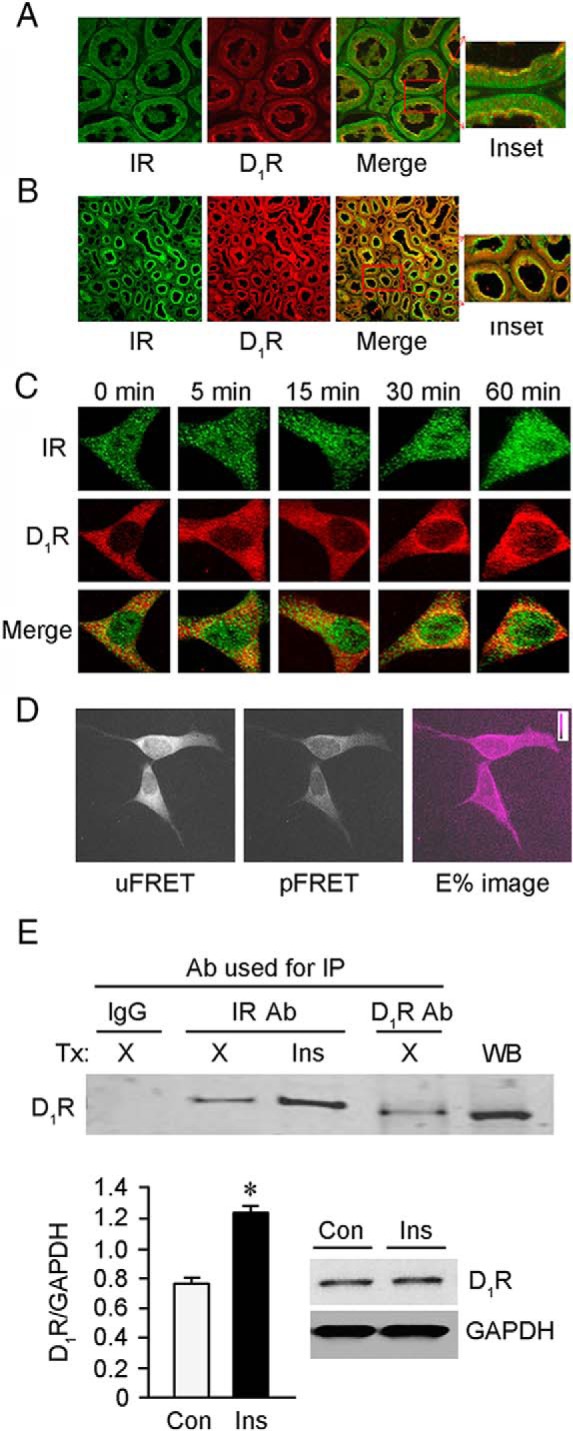
Figure 4.

Colocalization and coimmunoprecipitation of D1R and IR in hRPTCs and in kidney sections. A and B, D1R and IR colocalized (yellow, merge images) at the brush borders of RPTs in human (A) and rat (B) kidneys. C, D1R colocalized (yellow, merge images) with IR at the perinuclear area in the basal state. Their colocalization increased with insulin treatment, reaching a maximum at 30 minutes. D, Alexa Fluor 488-labeled IR was used as the donor, whereas Alexa Fluor 555-labeled D1R was used as the acceptor in the FRET dipole. The images (from left to right) are uFRET or uncorrected FRET, pFRET or processed or pure FRET, and E% or efficiency of energy transfer is around 30%. E, D1R and IR coimmunoprecipitated and the amount of which was increased by insulin (Ins, 100nM/30 min) treatment (Tx). X, vehicle; Ab, antibody; IP, immunoprecipitation; Con, control. D1R Ab was used for WB. The immunoblots to the right of the bar graphs indicate uniform expression of D1R in the cells, with or without insulin treatment.
