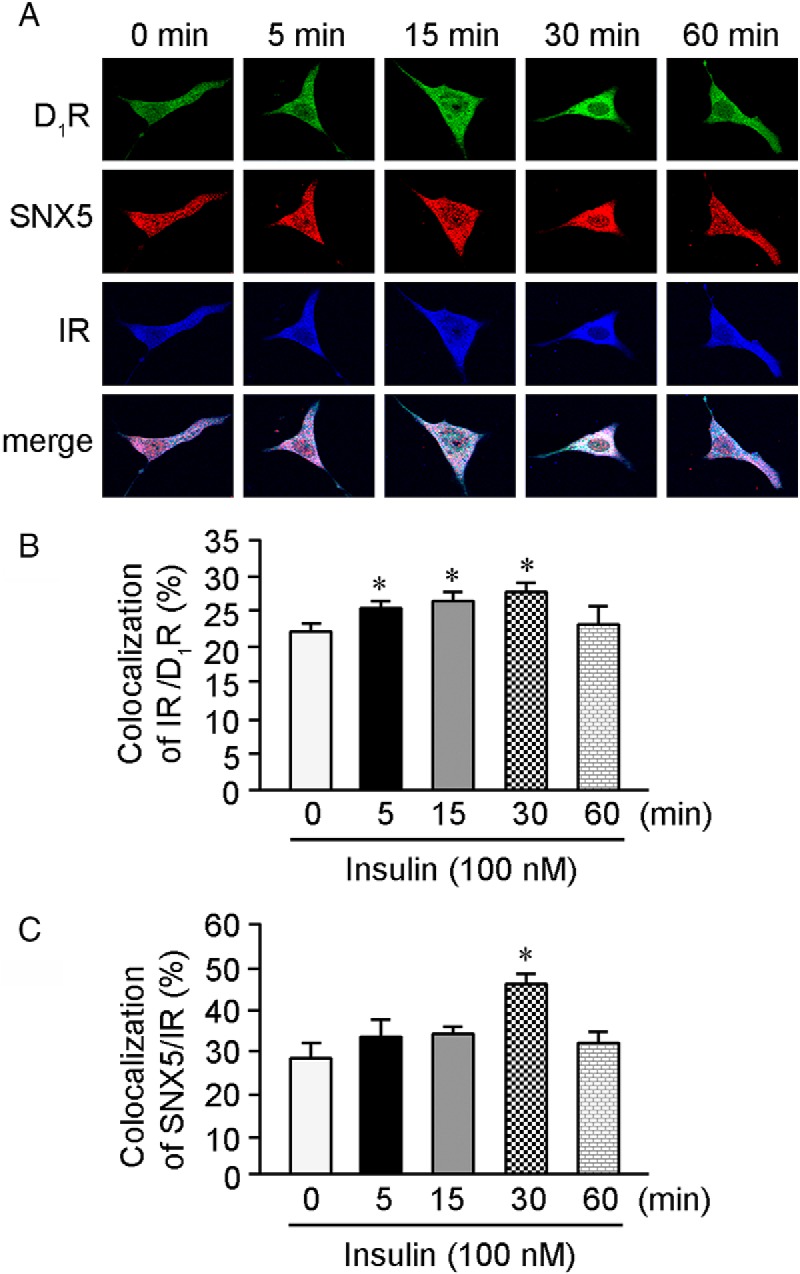
Figure 6.

Colocalization and quantification of colocalization among D1R, SNX5, and IR in hRPTCs. A, D1R (green), SNX5 (red), and IR (blue) colocalized (white, merge images) in hRPTCs. Insulin treatment gradually increased their colocalization at the perinuclear area, reached a maximum at 30 minutes and decreased at 60 minutes. B, The bar graph shows that the colocalization of D1R and IR gradually increased from 5 to 30 minutes and decreased at 60 minutes with insulin treatment (n = 4; *, P < .05 vs control, one-way ANOVA, Student-Newman-Keuls test). C, The bar graph shows that the increase in colocalization of SNX5 and IR reached significance at 30 minutes and decreased at 60 minutes with insulin treatment (n = 3; *, P < .05 vs control, one-way ANOVA, Student-Newman-Keuls test).
