
Figure 1.
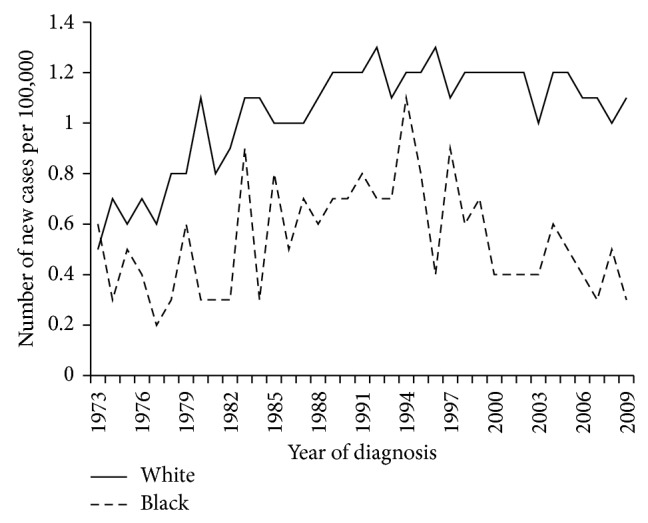
Age-adjusted incidence rates for blacks and whites, 1973–2009 (note: cases from SEER 9 database are included).
Official websites use .gov
A
.gov website belongs to an official
government organization in the United States.
Secure .gov websites use HTTPS
A lock (
) or https:// means you've safely
connected to the .gov website. Share sensitive
information only on official, secure websites.
Age-adjusted incidence rates for blacks and whites, 1973–2009 (note: cases from SEER 9 database are included).