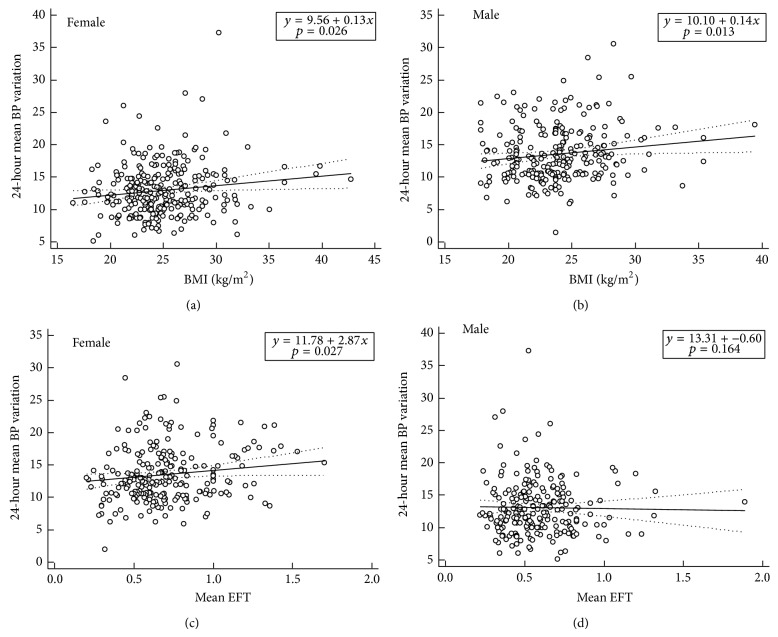
Figure 2.
Regression analysis between 24-hour mean blood pressure (BP) difference and body mass index (BMI) or mean epicardial fat thickness (EFT). 24-hour mean BP variation was significantly related to BMI in both females (a) and males (b). However, EFT was significantly correlated with 24-hour mean BP variation only in females (c), not in males (d).

