Figure 1.
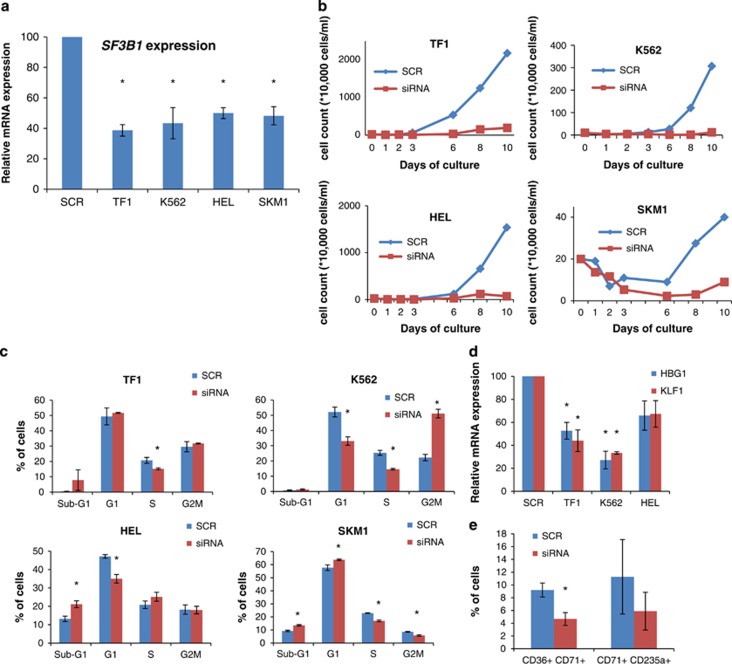
Effects of SF3B1 knockdown in myeloid cell lines. Each cell line transfected with siRNA targeting SF3B1 was compared with the corresponding cell line transfected with the scramble control. (a) SF3B1 mRNA expression measured 3 days after knockdown. (b) Growth curves of cells with SF3B1 knockdown, compared with cells transfected with the scramble control, as assessed by trypan blue exclusion. (c) Cell cycle analysis of cell lines following SF3B1 knockdown. (d) Erythroid differentiation in myeloid cell lines with SF3B1 knockdown treated with 50 μm hemin, as measured by HBG1 and KLF1 expressions relative to the scramble control. (e) Percentage of CD36+CD71+ and CD71+CD235a+ populations in K562 cells with SF3B1 knockdown compared with the scramble control. Results in subpanels a–d were obtained from scramble n=2 and SF3B1 siRNA as follows: a, n=3; b, n=3; c, n=3 for SKM1 and TF1, n=6 for HEL and n=9 for K562; d, n=3 for TF1 and HEL, n=6 for K562. Results in subpanel e were obtained from scramble n=4 and SF3B1 siRNA n=4. *P<0.05.

