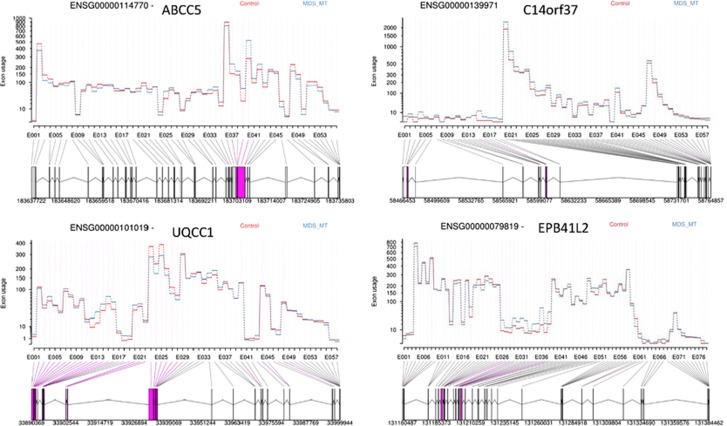
Figure 3.
Examples of genes showing significant differential exon usage between MDS patients with SF3B1 mutation in comparison with control, obtained from RNA-Seq data analysis using DEXSeq. The graphs show some of the top ranking genes with significant differential exon usage. The exons highlighted in purple represent the significant differential exon usage.

