
Fig. 2.
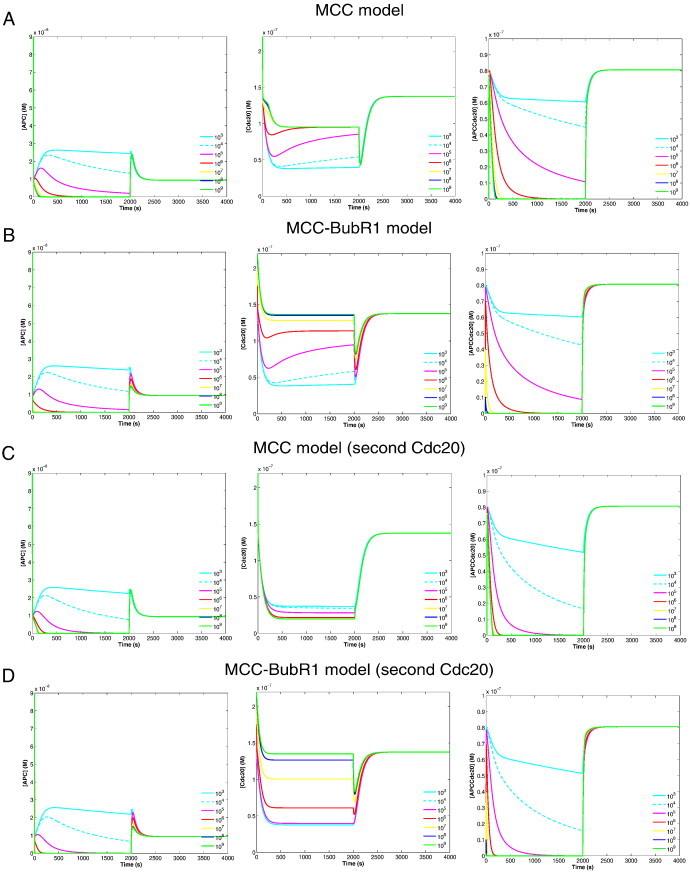
Dynamical behavior of core SAC component concentration versus time.
The columns from left to right show the APC, Cdc20, and APC:Cdc20 concentration (spindle attachment occurs at t = 2000 s). All results are presented for different values of the rate k5 (MCC binding to APC). Parameters setting are according to Table 1. Free APC concentration (left column) in all model variants is similar where its value at any given time is less than 30% of its initial concentration. The APC:Cdc20 dynamics (right column) in all model variants is also very similar, shows fast recovery and only with high MCC binding rate to APC shows fast inhibition for APC:Cdc20 activity. Cdc20 sequestration is depicted in the middle column. All model variants except the MCC-model variant that binds second Cdc20 (c.f. Panels A, B and D) are able to sequester about 80% of the free Cdc20 only with low MCC–APC binding rate. The MCC model variant that binds second Cdc20 (c.f. Panel C) is able to sequester around 95% of the free Cdc20 and independent of MCC–APC binding rate.