
Fig. 4.
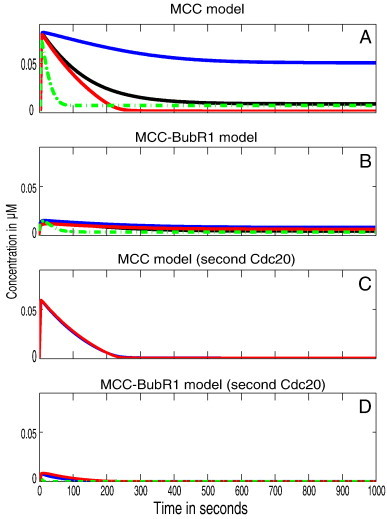
Spatial simulation of SAC model variants. The figures show the total concentrations over time for APC:Cdc20 with different parameter sets. All results are presented for different values of the APC/C binding rates (k5, k6 and k8). Blue, black and red lines refer to the different APC/C binding rates, 106 M− 1 s− 1, 108 M− 1 s− 1 and 1010 M− 1 s− 1 respectively. Dotted lines represent the simulations when Mad2 convection is included.
(A) Outcome of the simulated MCC core model (Reactions (1)–(5), and (7); cf. Table 1). It takes about 5 min to reach steady state except for the low rate value which takes 10 min. APC:Cdc20 is 90% inhibited only with high MCC–APC binding rate or when convection is included. (B) Outcome of the simulated MCC–BubR1 core model (Reactions (1)–(7); cf. Table 1). It takes about 3 min to reach steady state for any parameter set. (C) Outcome of the simulated MCC model that binds second Cdc20 (Reactions (1)–(5), (7),and (8); cf. Table 1). It takes about 3 min to reach steady state for any parameter set. (D) Outcome of the simulated MCC–BubR1 model that binds second Cdc20 (Reactions (1)–(8); cf. Table 1). It takes about 1.5 min to reach steady state for any parameter set.