
Fig. 5.
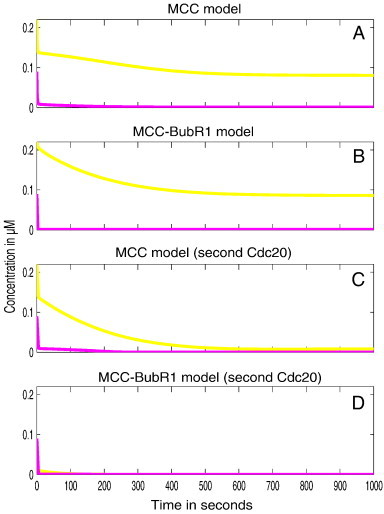
Spatial simulation of APC and Cdc20 dynamics. The figures show the total concentrations over time for free APC and free Cdc20. All results are presented for 108 M− 1 s− 1 value of the APC/C binding rates (k5, k6 and k8). We can clearly see that only for the MCC–BubR1 model variant that binds second Cdc20, complete APC and Cdc20 sequestration is achieved.