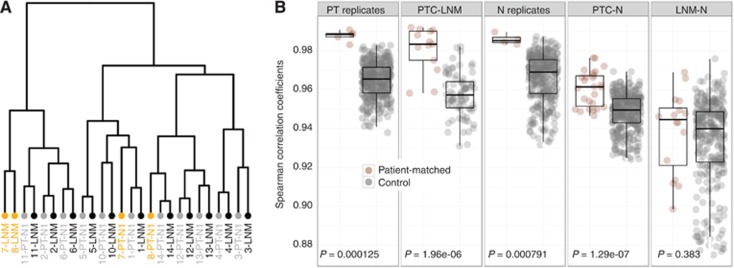
Figure 2.
Correlation between expression profiles of nodal metastases and patient-matched primary tumours. (A) Hierarchical clustering of primary tumours (PT, in grey) and patient-matched lymph node metastases (LNM, in black). Numbers denote patient identity. Patient-matched samples cluster together, except for patients 7 and 8 (orange labels). (B) Panel ‘PT replicates': correlation between blocks from the same primary tumour (brown) and between primary tumours from different patients (grey). Panel ‘PTC-LNM': correlations between primary tumours and patient-matched nodal metastasis (brown) and between primary tumours and unrelated nodal metastasis (grey). Panel ‘N replicates': same as ‘PT replicates, using non-cancerous tissues instead of primary tumours. Panel ‘PTC-N': correlation between primary tumours and patient-matched non-cancerous thyroid tissues (brown) and between primary tumours and unrelated non-cancerous thyroid tissues (grey). Panel ‘LNM-N': same as ‘PTC-N' using nodal metastases instead of primary tumours.

