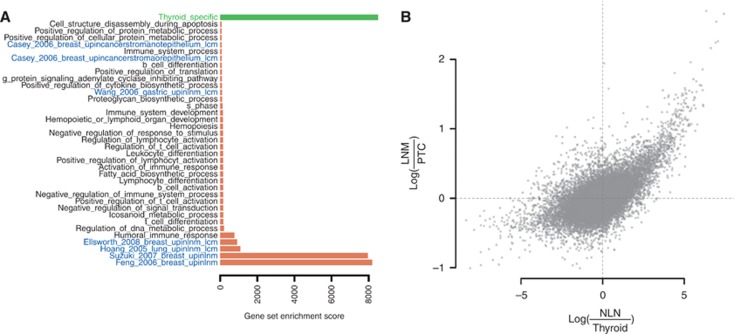
Figure 3.
Gene expression differences between nodal metastases and patient-matched primary tumours. (A) A gene set enrichment analysis (Subramanian et al, 2005) for the nodal metastases vs patient-matched primary tumours comparison with gene sets from the Gene Ontology Biological Processes database (black) and curated gene sets from previous studies investigating nodal metastasis or stromal gene expression (Hoang et al, 2005; Wang et al, 2005; Feng et al, 2007; Suzuki and Tarin, 2007; Casey et al, 2009; Ellsworth et al, 2009; blue, only significant gene sets are shown (see Supplementary Table S2 for the full list of investigated gene sets) and a signature of thyroid differentiation (Tomás et al, 2012; green). Red bars denote increased expression in metastases compared with primary tumours and green bars denote decreased expression. (B) Each point denotes a gene with expression average fold change between normal lymph node (NLN) and non-cancerous thyroid (Thyroid) on the x axis and average fold change between nodal metastases (LNM) and primary tumours (PTC) on the y axis. Spearman's correlation coefficient between these two variables is 0.39 (P<2 × 10⁻¹⁶).

