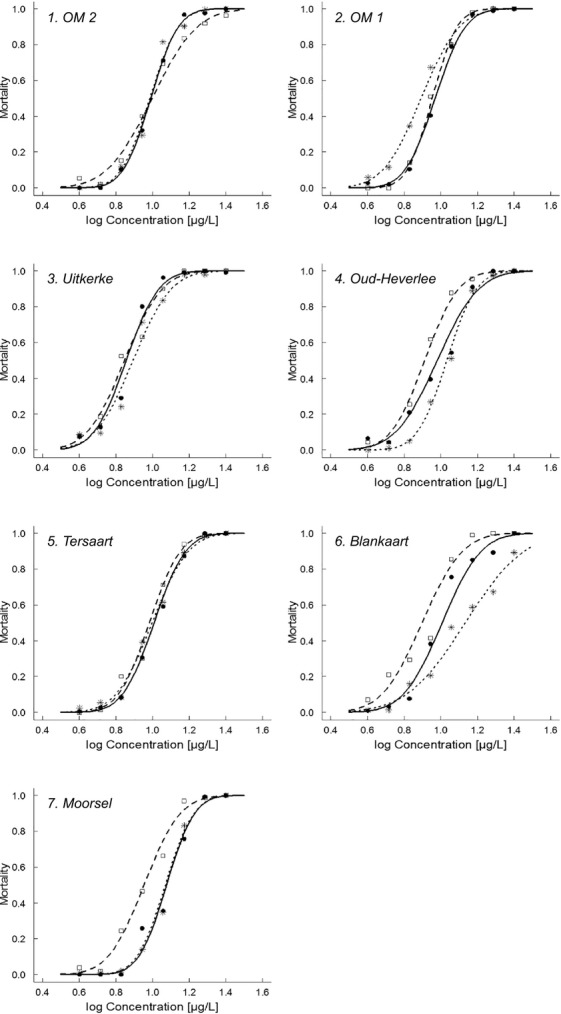
Figure 1.

Concentration-response curves for carbaryl for the study populations as sampled from the dormant egg banks (original field populations, full line and circles), the control populations (control condition in experimental evolution trial; dashed line and squares) and the carbaryl-selected populations (from the experimental evolution trial; dotted line and stars) for each of seven natural Daphnia magna populations isolated from Flemish farmland ponds situated in areas that differ in land use intensity. The figures of the different populations are ranked based on land use intensity in the neighbourhood of the pond (OM2: low land use – Moorsel: high land use; see Table S4).
