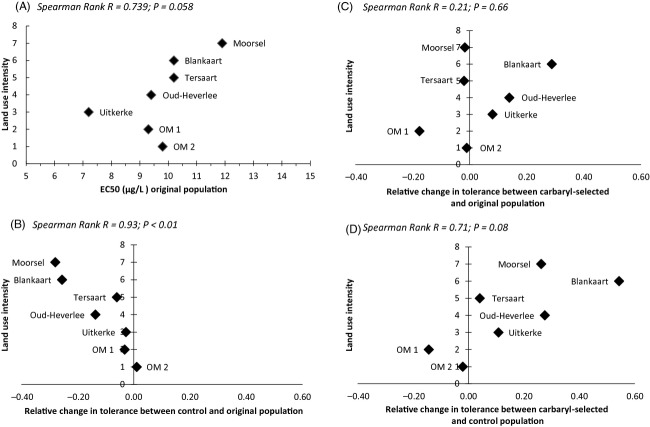
Figure 2.
Spearman rank correlations between land use intensity (determined following Coors et al. 2009) and (A) absolute value of the EC50 (μg L−1) for carbaryl of the original populations, (B, C) the change in EC50 during the selection experiment [log2 (EC50 treatment/EC50 original)], and (D) the change in carbaryl tolerance between the control and the carbaryl-selected populations [log2 (EC50 carbaryl-selected/EC50 control)]. Panel B shows that the loss in carbaryl tolerance in control populations compared to the original populations increases with land use intensity around the pond [log2 (EC50 control/EC50 original)]; this correlation is significant. Panel C shows the change in carbaryl tolerance in carbaryl-selected populations compared to the original populations in relation to land use intensity around the pond [log2 (EC50 carbaryl-selected/EC50 original)]; this correlation is not significant. Panel D shows the change in carbaryl tolerance between the control and the carbaryl-selected populations in relation to land use intensity [log2 (EC50 carbaryl-selected/EC50 control)]; this relationship is marginally nonsignificant.

