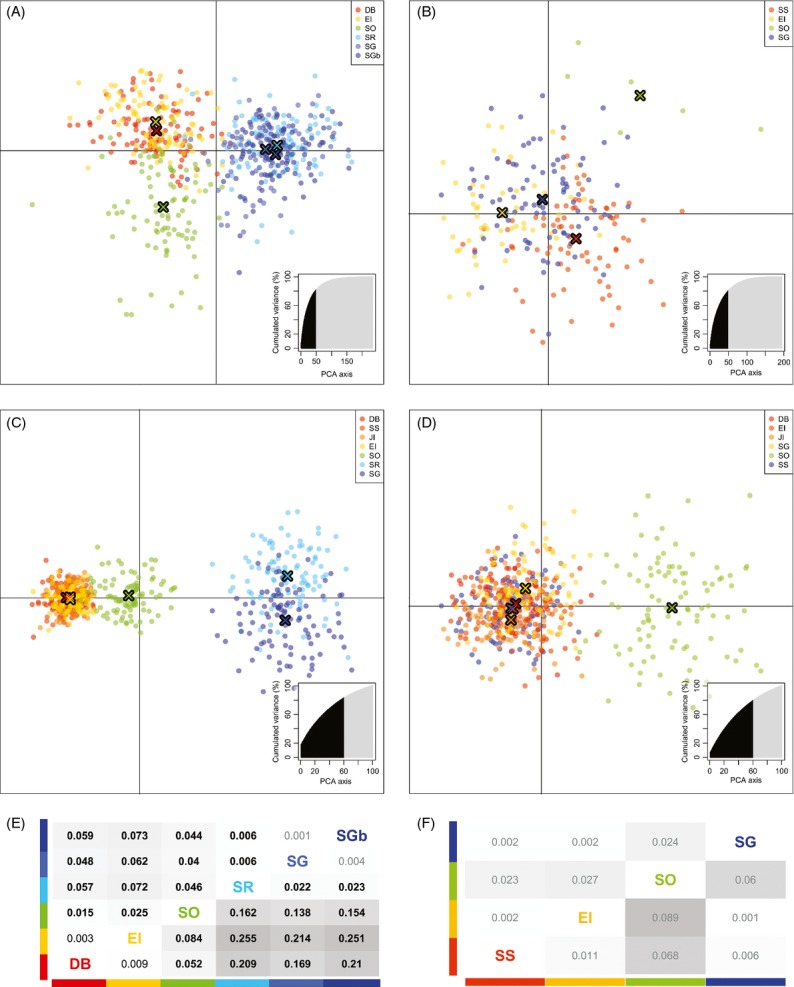
Figure 4.

Genetic structure for Champsocephalus gunnari and Notothenia rossii. Scatter plots of the first two principal components of the DAPC of C. gunnari (A, C) and N. rossii (B, D) from empirical microsatellite data (A, B) and projected synthetic data (C, D) using sampling locations as prior clusters. Dots represent individuals, and the different colours represent sampling locations: Dallman Bay (DB), South Shetland Islands (SS), Joinville Island (JI), Elephant Island (EI), South Orkney Islands (SO), Shag Rocks (SR) and South Georgia (SG and SGb). The sampling location centroids are represented by coloured crosses. The number of principal components retained and the cumulative variance explained are highlighted in black in the inset. Below the DAPC are tables of pairwise estimates of differentiation ( above diagonal and
  below diagonal) for C. gunnari (E) and N. rossii (F) from empirical data. Differentiation values are represented as grey heat maps: the darker the grey, the higher the relative value among species comparison. Differentiation values significantly different from zero are in black, and those still significant after correction for multiple testing are in boldface.
