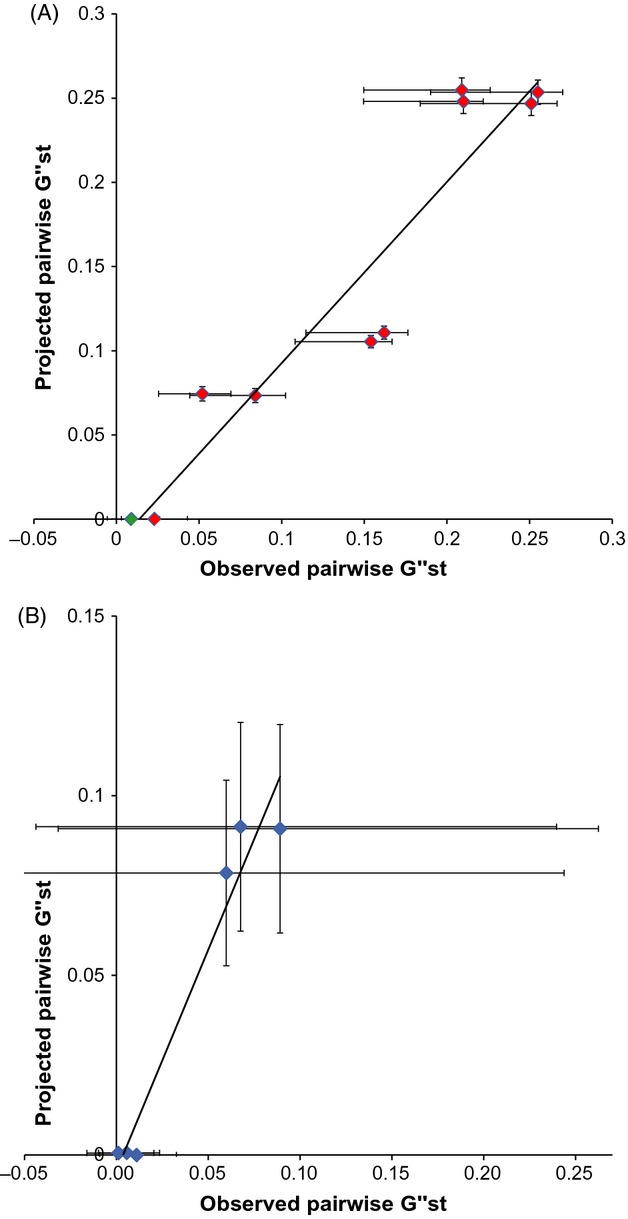
Figure 5.

Correlations of empirical and projected pairwise  for (A) Champsocephalus gunnari and (B) N. rossii. Projected
  data are the means of 100 repeat simulations using random selection of individual year migration matrices, with standard deviations shown by the vertical error bars. Data points are coloured according to the significance of the empirical
  : blue values are nonsignificant; green values have P < 0.05; and red values are significant after multiple testing correction. Horizontal error bars are the 95% confidence intervals of empirical
  estimates.
