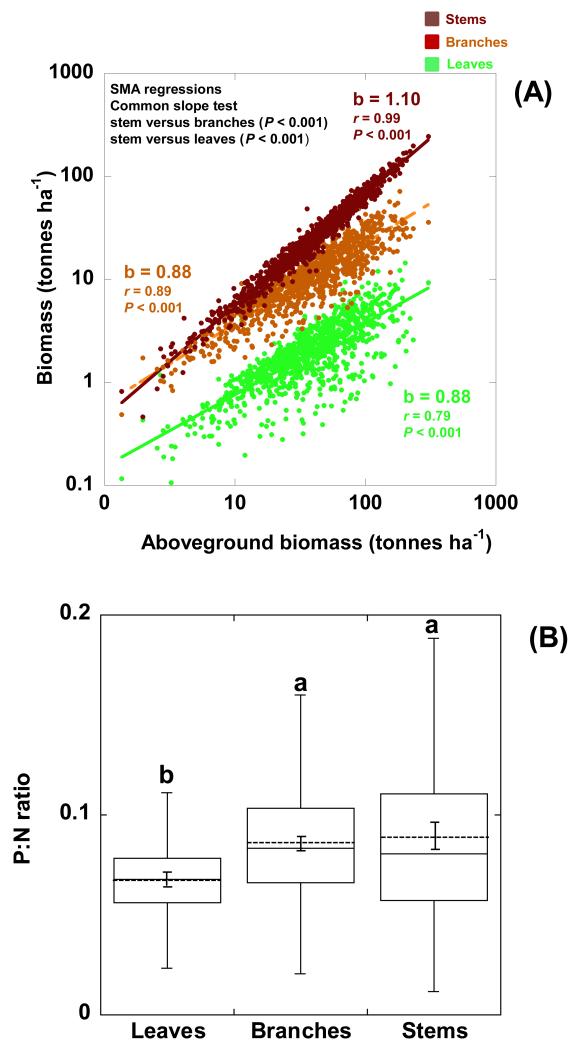
Figure 1.
Allometric relationships of foliar, branch and stem biomasses with total aboveground biomass (A). Boxplots of the P:N ratios of leaves, branches and stems median (the continuous line into the boxes) with the corresponding quartiles. The dashed lines into the boxes represent the mean values ± (S.E.). Different letters indicate statistically significant differences (P<0.05) (B). (SMA = Slope Major Axis).

