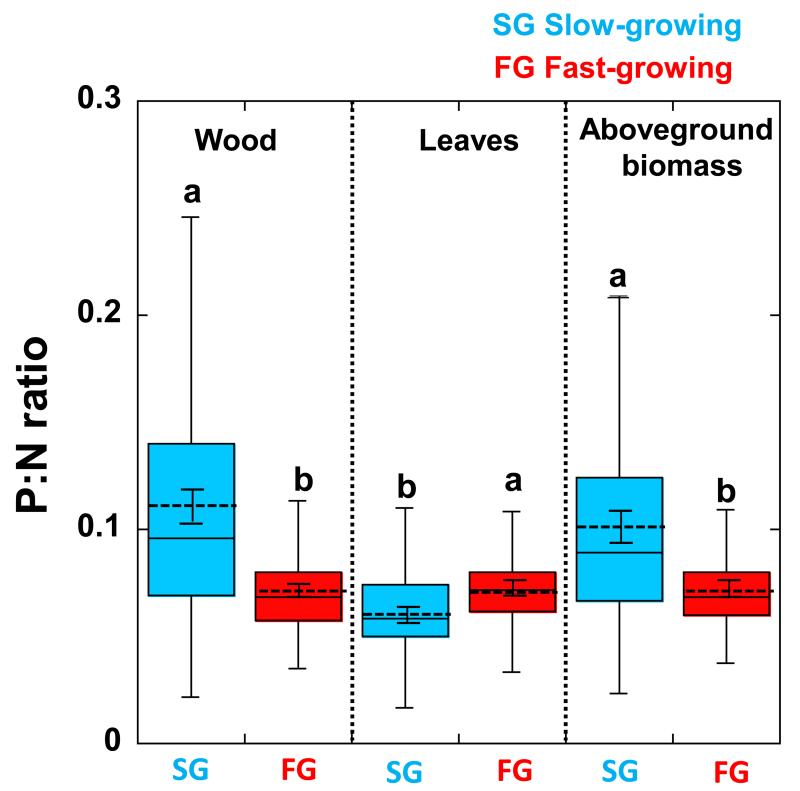
Figure 4.
Boxplot of P:N rations of wood, leaves and total aboveground biomass median (the continuous line into the boxes) with the corresponding quartiles in slow- and fast-growing tree species. The dashed lines into the boxes represent the mean values ± (S.E.). Different letters indicate statistically significant differences (P<0.05) between slow- and fast-growing species. Slow-growing (Pinus uncinata, Quercus ilex, Quercus suber, Abies alba, Quercus cerrioides, Quercus humilis, Quercus petraea, Fagus sylvatica) and fast-growing tree species (Pinus halepensis, Pinus sylvestris, Pinus nigra, Pinus pinaster, Castanea sativa, Pseudotsuga menziesii, Pinus radiata, Populus tremula, Populus hybrides, Populus nigra, Fraxinus angustifolia, Fraxinus excelsior, Prunus avium, Cedrus deodara).

