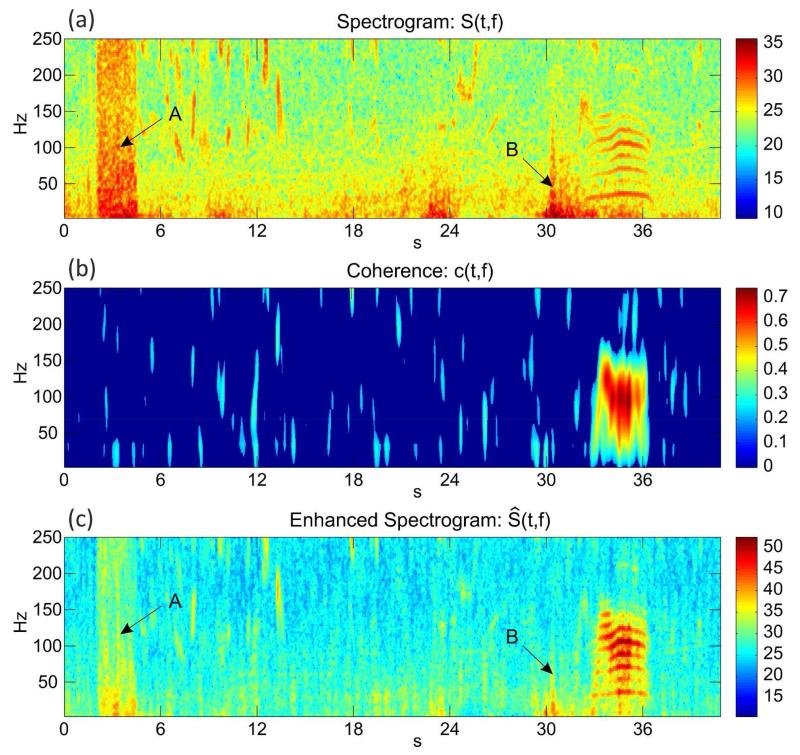
Figure 4.
The effect of sound enhancement. (a) The input spectrogram with a rumble at 35s and several noise sources, e.g. broadband noise (label “A” and label “B”); (b) The coherence obtained for each location in the spectrogram. The highest values are obtained in the area of the rumble; (c) The enhanced spectrogram after weighting with the coherence. The signal-to-noise ratio of the rumble is clearly improved and the noise sources are attenuated.

