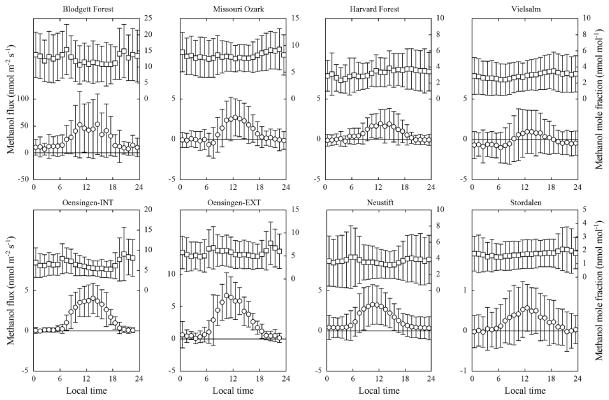
Figure 1.
Hourly bin-averaged diurnal variation of methanol fluxes (circles; left y axis) and mole fractions (squares; right y axis) at the eight study sites (error bars represent ± one SD). Note the differing scaling on the y axis. Data from Oensingen-INT, Oensingen-EXT and Neustift are exclusive of periods influenced by management practises.

