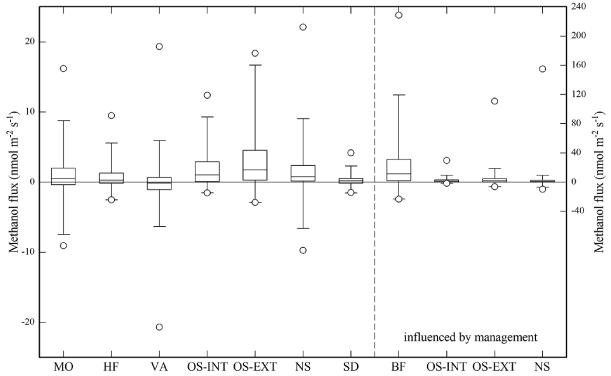
Figure 2.
Box-plots of methanol fluxes at the eight study sites. The left y axis refers to sites/measurements not influenced by site management events, while the right y axis (note differing scaling) shows data for Blodgett Forest and the grassland sites inclusive of measurements during/after management (MO – Missouri Ozark, HF – Harvard Forest, VA – Vielsalm, OS-INT – Oensingen-Intensive, OS-EXT – Oensingen-Extensive, NS – Neustift, SD – Stordalen, BF – Blodgett Forest). Box plots show minima/maxima (circles), 5 and 95 % quartiles (whiskers), the interquartile range (box) and the median (horizontal line).

