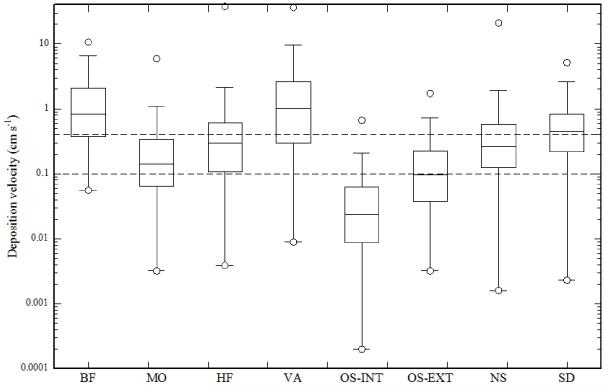
Figure 4.
Box-plots of nighttime methanol deposition velocities at the eight study sites. Horizontal dashed lines indicate the range of deposition velocities (0.1–0.4 cm s−1) used in global budgets (see also Table 2). Box plots show minima/maxima (circles), 5 and 95 % quartiles (whiskers), the interquartile range (box) and the median (horizontal line).

