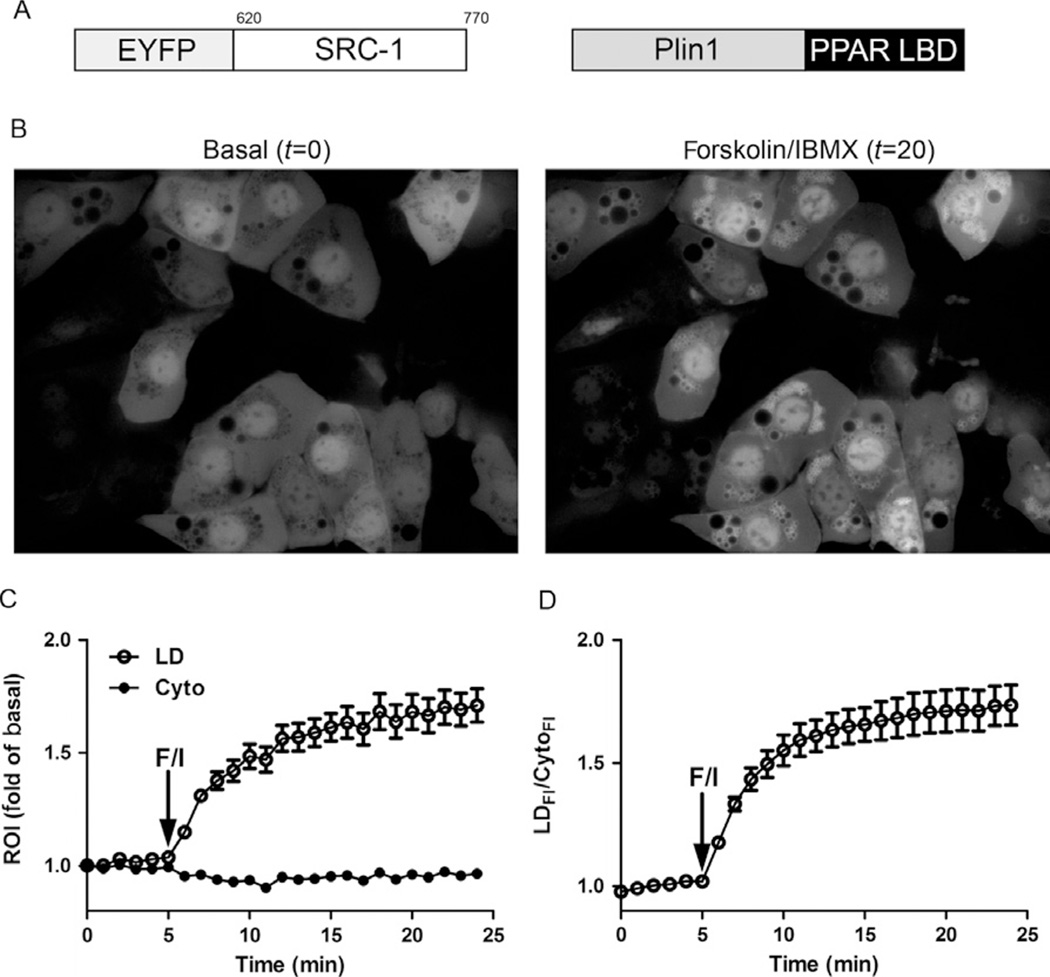
Figure 15.2.
Fluorescence sensor for imaging intracellular fatty acid production. (A) A schematic of the constructs used for the fluorescence fatty acid sensor (amino acids for SRC1 are shown). PLIN1, perilipin-1; LBD, ligand-binding domain. (B) EYFP fluorescence images of the lipid droplet fatty acid sensor stably expressed in BA cells. Basal image capture at t = 0 and at t = 20 min, 15 min after addition of forskolin/IMBX (F/I). (C) Quantification of the region of interest (ROI) from lipid droplet (LD) or cytoplasm (Cyto) and expressed as a fold of basal. (D) Data were further expressed as a ratio of the fluorescent intensity from the LD (LDFI) over the fluorescence intensity from the cytoplasm (CytoFI). (For color version of this figure, the reader is referred to the online version of this chapter.)

