Figure 1.

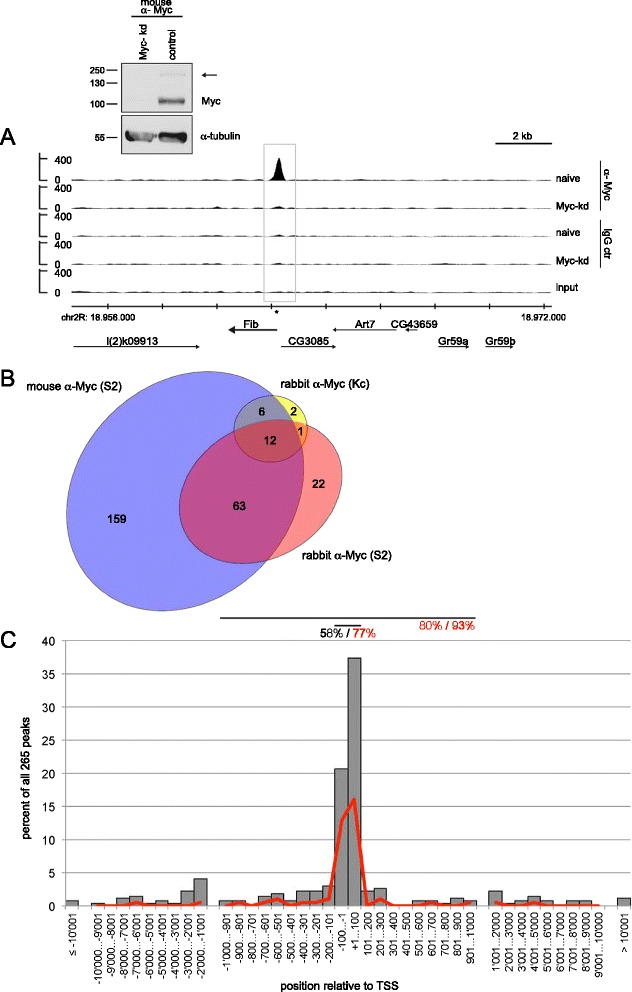
Myc binding sites in Drosophila. A) Myc binding to the Fibrillarin locus as an example of a binding site in S2 cells. Strong binding is observed with mouse α-Myc antibodies in naïve S2 cells (1st lane), but not upon Myc depletion (2nd lane) or with control mouse IgG (3rd and 4th lane); the grey box marks the Myc binding peak as called by the software MACS, the asterisk shows a consensus E-box (‘CACGTG’). Chromosomal coordinates (on chromosome 2R) are indicated below the traces, as are the extents and orientations of genes in this region. The Western blot illustrates the efficiency of Myc depletion; the arrowhead points to a band presumably arising from post-translational modification of Myc. Molecular weight markers (in kD) are indicated. B) Overlaps of Myc binding sites from three different ChIPseq experiments, using either mouse monoclonal or rabbit polyclonal anti-Myc antibodies, and chromatin from S2 or Kc167 cells. Only peaks called by the software as ‘significant’ were considered, that is, with false discovery rate (FDR) of <10%. C) Position of Myc binding peaks relative to the nearest transcription start site (TSS). Data are distributed in 100-nt bins for a distance of up to 1,000 nt from the TSS and in 1,000-nt bins for distances between 1,000 and 10,000 nt, and shown as percent of all 265 peaks. Grey bars show all Myc binding peaks, the red line only the Myc binding peaks containing a canonical E-box within a 100 nt window straddling the Myc binding summit. Horizontal lines above the graph illustrate windows of +/− 100 nt and +/− 1,000 nt around the TSS, containing 58% and 80% of all Myc peaks, and 77% and 93% of the Myc peaks with canonical E-boxes, respectively.
