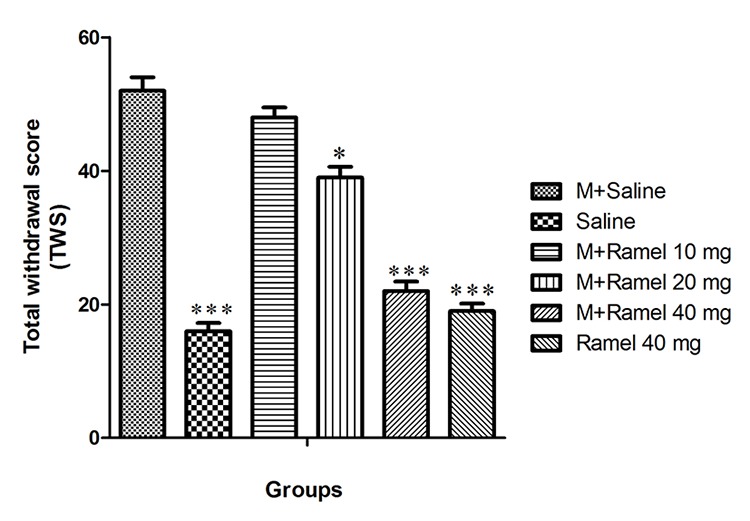
Figure 1.

This figure shows total withdrawal score (TWS) in dependent group under treatment by systemic administration of ramelteon (10, 20, 40 mg/kg, bw), negative control group and ramelteon treatment group (40 mg/kg, bw) compared with positive control group. Data are expressed as the mean±SEM; ***P<0.001 and *P<0.05 different from positive control group; M: Morphine, Ramel: Ramelteon
