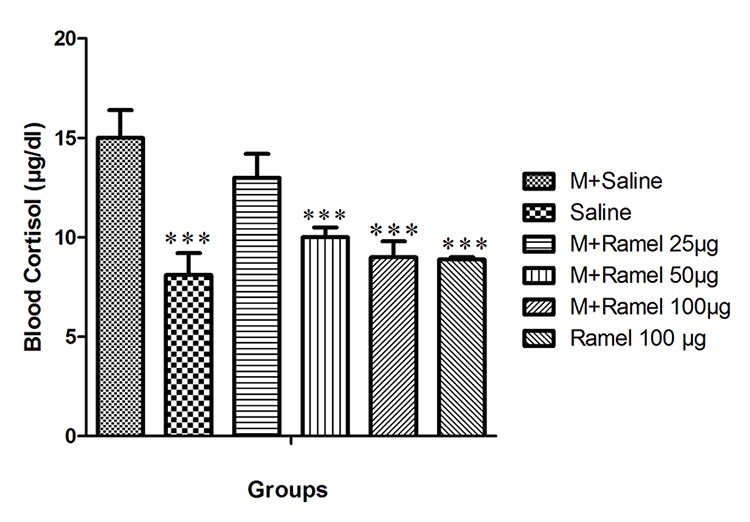
Figure 4.

This figure shows blood cortisol level after the injection of naloxone in dependent group under treatment treated by central administration of ramelteon (25, 50 or 100 μg/5 μl/rat, icv) and negative control group and ramelteon treatment group (100 μg/5 μl/rat, icv) compared with positive control group. Data are expressed as the mean±SEM; ***P<0.001 different from control positive group; M: Morphine, Ramel: Ramelteon.
