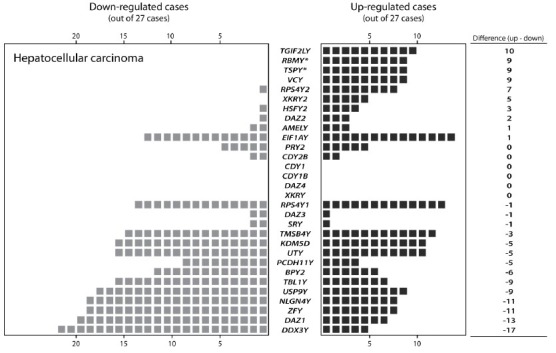
Figure 2.

Gene expression profile of MYS protein-coding genes in male liver cancer cases. The case number showing either up-regulation or down-regulation in cancer specimens is indicated for each gene, according to the RNA-Seq gene expression data derived from the database of the Cancer Genome Atlas project. Twenty-seven pairs of tumor and corresponding nontumor tissue were analyzed. Each black or gray square indicates an up or down respectively the expression of the corresponding Y chromosome genes in the tumor to nontumor pairs.
