
Figure 3.
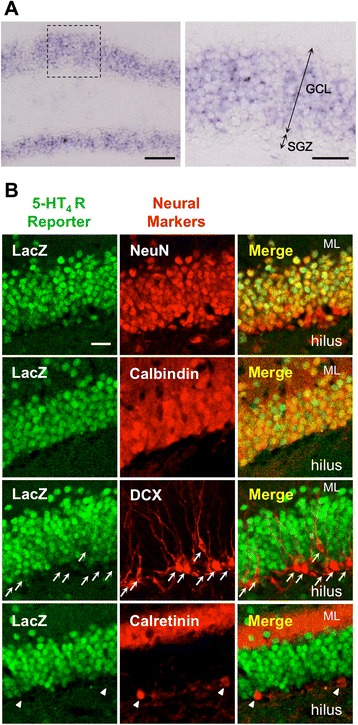
Expression of the 5-HT4 receptor in the DG. (A) in situ hybridization analysis of 5-HT4 receptor mRNA expression. GCL: granular cell layer, SGZ: subgranular zone. Scale bars: 100 μm (left) and 30 μm (right). (B) Representative images of β-galactosidase (LacZ) and markers of granule cells; NeuN, calbindin, doublecortin (DCX), and calretinin. Scale bar: 20 μm. Arrows represent DCX-positive cells. Arrow heads represent calretinin-positive cells.