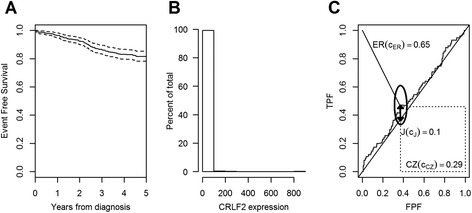
Figure 2.

Applicative example on acute lymphoblastic leukemia. Panel A. Estimated survival curve with 95% confidence bands. Panel B. Histogram for the CRLF2 expression. Panel C. ROC curve for the CRLF2 biomarker with the three objective functions: the Youden index J(ĉJ) represented by the thick line segment, the concordance probability CZ(ĉCZ) represented by the area of the dotted rectangle and the distance from the (0,1) corner represented by the thin line segment. The 95% elliptic asymptotic confidence interval of (FPF(ĉ), TPF(ĉ)) is also represented.
