
Figure 6.
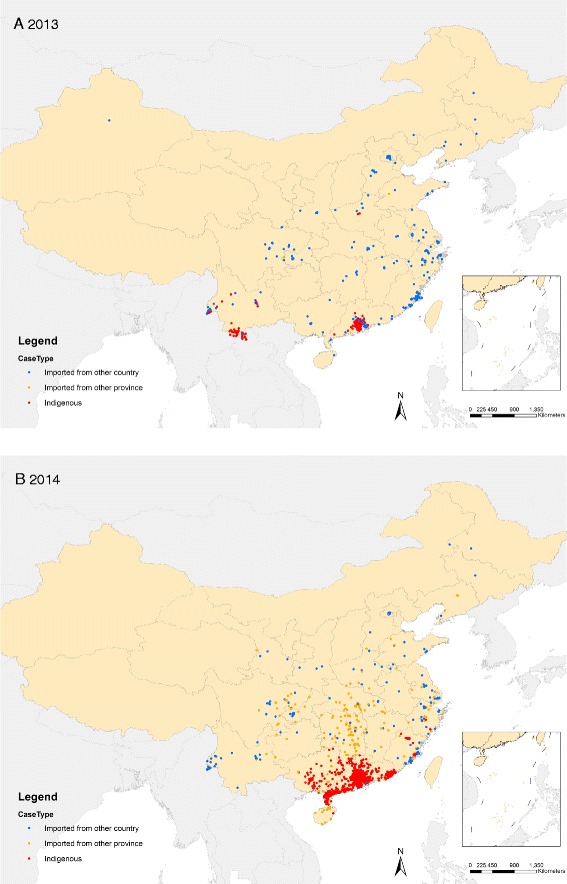
The geographic distribution of dengue cases in mainland China, 2013 and 2014. Panel A: The distribution of dengue cases in 2013 (N = 4,779). Panel B: The distribution of dengue cases in 2014 (N = 47,056).
Official websites use .gov
A
.gov website belongs to an official
government organization in the United States.
Secure .gov websites use HTTPS
A lock (
) or https:// means you've safely
connected to the .gov website. Share sensitive
information only on official, secure websites.
The geographic distribution of dengue cases in mainland China, 2013 and 2014. Panel A: The distribution of dengue cases in 2013 (N = 4,779). Panel B: The distribution of dengue cases in 2014 (N = 47,056).