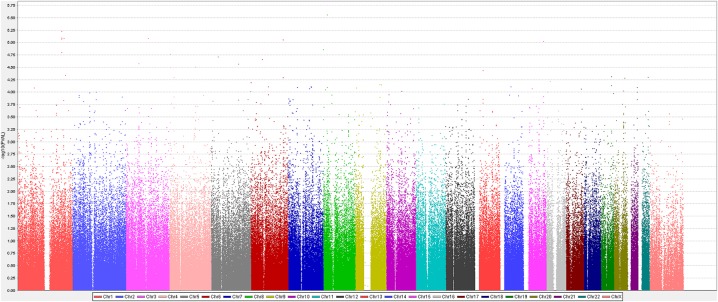
Figure 1.

Manhattan plot of genome-wide association with perioperative myocardial infarction in stage I analysis. The x axis represents the genome in physical order (coloured by chromosome); the y axis showing –log10(p) for all single nucleotide polymorphisms (SNPs). None of the SNPs reached genome-wide significance (p<9.09×10⁻⁸), but 521 SNPs met the prespecified discovery threshold p<0.001 for inclusion in stage II analyses (minimum p=2.76×10⁻⁶, rs2044061 on chromosome 8).
