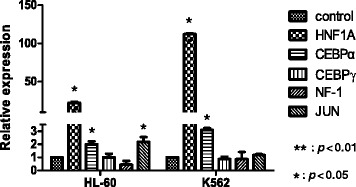
Figure 3.

Quantitative RT-PCR analysis of the expression of potential transcription factors for the AQP9 gene after 5′Aza treatment in HL-60 and K562 cells. The expressions of five transcription factors, including HNF1A, CEBPα, CEBPγ, NF-1, and JUN, with or without 5′Aza treatment in HL-60 and K562 cells, were determined by quantitative RT-PCR. Sample data were normalized to the control gene GAPDH for each cell line individually.
