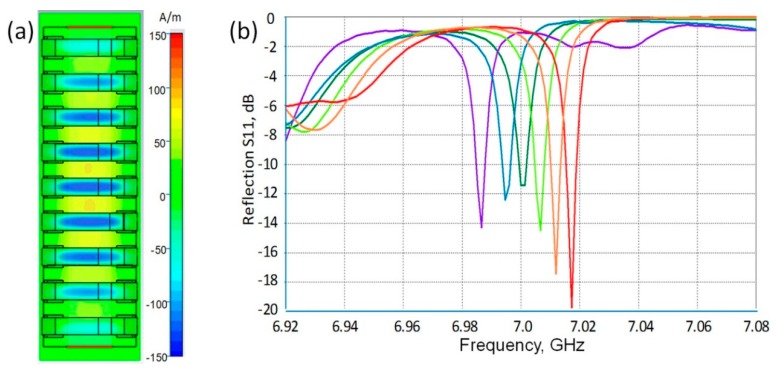
Figure 11.
(a) Simulated field pattern in the cross-section of the sensor presented in Figure 10 confirming the formation of sin-phase Fano-type resonances in the DR array; (b) shifts of resonance related S11 dips (from red to violet) at changing the analyte relative permittivity from 1 to 3 by equal steps.

