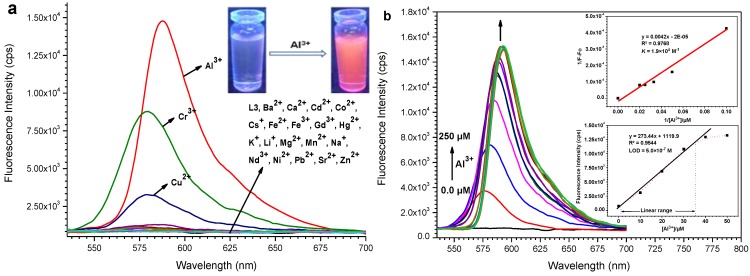
Figure 2.
(a) Fluorescence spectra (λex = 520 nm) of L3 (50 µM) in presence of various metal ions (50 µM) in MeOH−DMSO (99:1 v/v). Inset: Visual color change of probe upon addition of Al3+; (b) The fluorescence emission spectral pattern of L3 in the presence of increasing concentrations of Al3+ (0, 10, 20, 30, 40, 50, 75, 100, 125, 150, 175, 200, 225, 250 µM). Inset: Linear regression plot of fluorescence intensity change 1/(F-F0) as a function of concentration 1/[Al3+] (top), fluorescence enhancement change as a function of concentration of Al(III) added (bottom).

