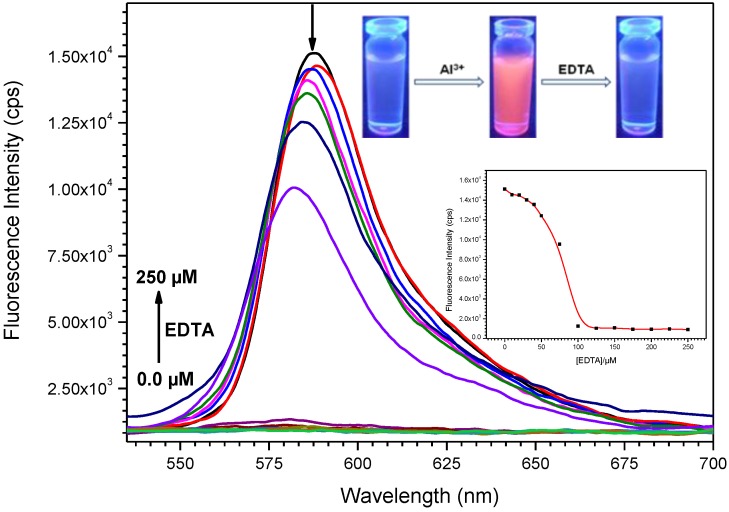
Figure 6.
The variation in fluorescence emission spectra of L3 + Al3+ upon addition of EDTA (0, 10, 20, 30, 40, 50, 75, 100, 125, 150, 175, 200, 225, 250 µM). Inset: Color changes of probe + Al3+ upon addition of EDTA (1.0 equiv.) (top), fluorescence spectral changes at 587 nm as a function of the amount of EDTA (bottom).

